
Understanding Googlebot’s Rendering Pipeline
Modern client-side rendered (CSR) applications rely heavily on JavaScript to inject content into the Document Object Model (DOM). For search engines, this introduces a critical dependency: Google must execute your JavaScript before it can evaluate, rank, or index your content. Understanding Googlebot’s rendering pipeline is essential for frontend developers and SEO engineers who need to minimize indexing latency, prevent partial rendering, and guarantee that dynamically injected content survives the crawl.
This guide breaks down the two-wave indexing architecture, Web Rendering Service (WRS) execution constraints, and framework-agnostic debugging workflows required to validate and optimize CSR pipelines.
The Two-Wave Indexing Architecture
Google does not render pages synchronously during the initial crawl. Instead, it operates on a two-wave architecture:
- Initial Fetch & Parse: Googlebot fetches the raw HTML, extracts static links, meta tags, and canonical URLs, and queues the page for rendering.
- Rendering Queue & Execution: Pages are placed in a prioritized queue. Once scheduled, a headless Chromium instance executes JavaScript, resolves network requests, and constructs the final DOM.
The two waves differ in more than timing: the first is a cheap fetch that runs immediately, while the second is an expensive render that waits its turn.
Queue prioritization is non-deterministic but heavily influenced by site authority, historical crawl frequency, server response times, and internal link velocity. High-traffic, well-linked pages typically render within hours, while low-authority or deeply nested routes can wait several days.
CDN edge caching and Cache-Control headers directly impact this pipeline. If your origin returns Cache-Control: max-age=0 or aggressive no-cache directives, Google may trigger unnecessary re-fetches, consuming crawl budget and delaying render queue placement. Aligning your caching strategy with the baseline mechanics outlined in Crawling and Rendering Fundamentals for Client-Side Apps ensures predictable pipeline behavior and reduces redundant crawl overhead.
Measurable Validation:
- Monitor
X-Googlebot-Renderheaders in server logs (if available via enterprise plans) or correlateLast-Modifiedtimestamps in Google Search Console with deployment cycles. - Track
crawl-delayand queue times using the URL Inspection Tool’s “Crawled” vs. “Rendered” timestamps.
JavaScript Execution & Resource Loading in WRS
Google’s Web Rendering Service (WRS) runs on a continuously updated version of headless Chromium. It supports modern JavaScript features (ES2020+, WebAssembly, dynamic import()), but it operates under strict execution budgets. Heavy hydration cycles, synchronous XHR calls, or unoptimized third-party scripts can block DOM completion, causing the WRS to time out and index an incomplete page state.
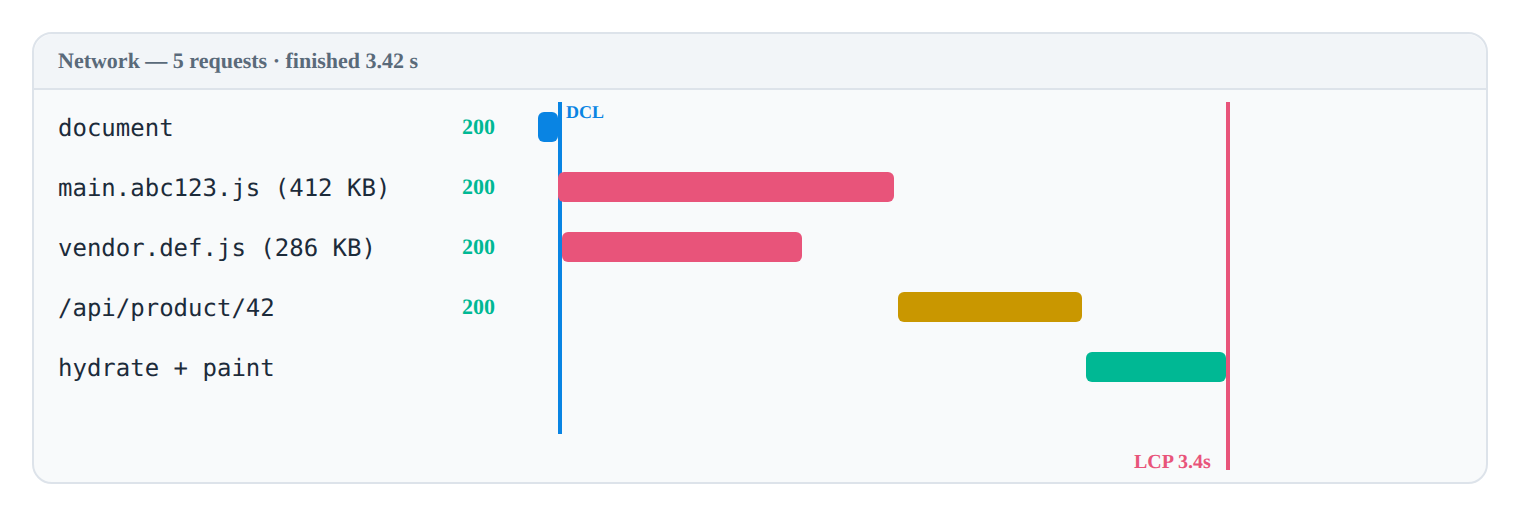
To optimize parse timing, defer non-critical scripts and leverage native module loading:
<!-- Critical framework bootstrap -->
<script type="module" src="/app.js" defer></script>

<!-- Analytics & non-essential tracking -->
<script src="/analytics.js" async></script>

<!-- Legacy fallback (if required) -->
<script nomodule src="/app-legacy.js" defer></script>
SEO/Rendering Impact:
type="module"ensures scripts execute after HTML parsing and defer by default, preventing render-blocking on the main thread.asyncallows third-party scripts to download without blocking parsing, but execution order is unpredictable. Use only for independent scripts (e.g., analytics) that do not affect initial content visibility.- Misconfigured script loading forces WRS to wait for synchronous execution, increasing the likelihood of hitting execution timeouts and triggering partial indexing.
Monitoring JavaScript Execution Limits and Crawl Budget is critical when deploying large bundles. Exceeding WRS memory or CPU thresholds results in pipeline abandonment, leaving critical content unindexed and link equity stranded.
Post-Render DOM Construction & Indexing Signals
Once JavaScript execution completes and the network is idle, WRS captures a DOM snapshot. This snapshot is parsed for ranking signals, structured data, and meta tag extraction. The timing of this snapshot is typically aligned with window.onload or a network-idle state. If your application relies on setTimeout, IntersectionObserver, or lazy hydration to inject primary content, that content may be excluded from the snapshot.
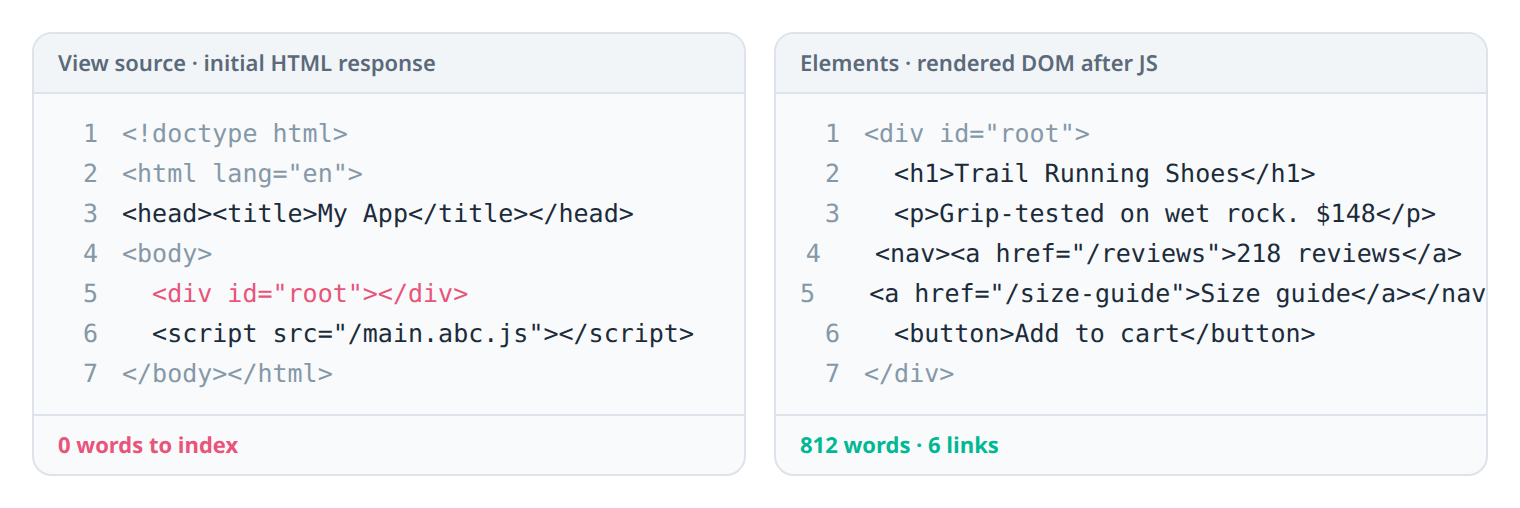
<div id="root"> shell, and only after the render pass does the DOM (right) contain indexable content.Hydration mismatches between server-rendered HTML and client-side React/Vue/Angular hydration can also corrupt the DOM. When WRS encounters mismatched nodes, it may discard dynamically injected elements, resulting in missing text, broken internal links, or stripped structured data.
When CSR latency consistently exceeds acceptable thresholds or hydration complexity introduces unpredictable indexing failures, evaluating Client-Side vs Server-Side Rendering for SEO architectures becomes necessary. SSR or static pre-rendering guarantees immediate content availability, bypassing the render queue entirely for core pages.
Validation Checklist:
- Verify JSON-LD and Open Graph tags exist in the post-render DOM using
document.querySelector('script[type="application/ld+json"]'). - Ensure all
<meta name="description">and<title>tags are updated before the WRS snapshot triggers. - Use the URL Inspection Tool’s “View Crawled Page” to confirm structured data survives execution.
Framework-Aware Debugging Workflows
Debugging CSR indexing requires simulating Googlebot’s exact execution environment. Follow this step-by-step workflow to validate rendering across React, Vue, and Angular implementations:
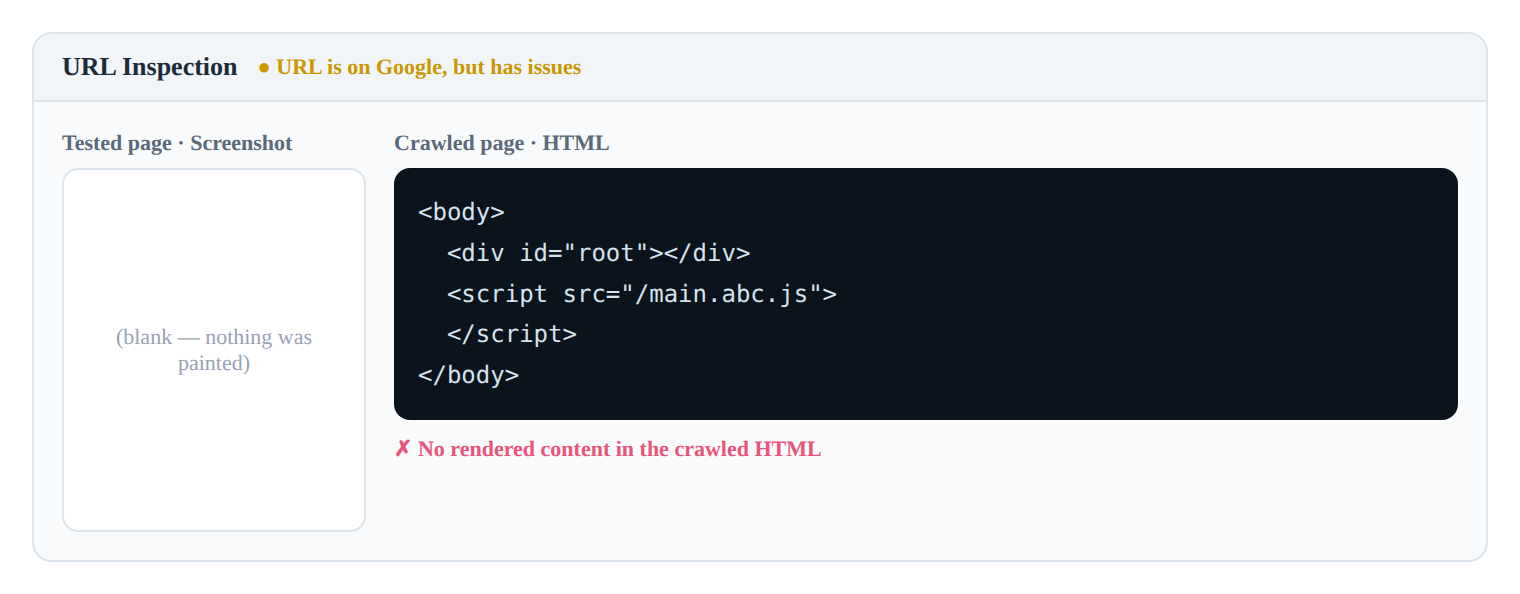
#root — the tool is telling you Googlebot rendered nothing.Step 1: Configure Headless Browser with Googlebot UA
Use Playwright or Puppeteer to emulate WRS behavior. The Googlebot user-agent string triggers specific Chromium optimizations and disables certain client-side tracking scripts that would otherwise interfere with rendering.
Step 2: Capture Rendered DOM & Network Waterfall
Run a controlled navigation, wait for network idle, and extract the final DOM. Analyze the network waterfall to identify render-blocking third-party requests, failed dynamic imports, or excessive asset payloads.
Step 3: Implement Execution Verification
Implementing How to check if Googlebot executes your JavaScript via console logging, DOM mutation observers, and UA sniffing provides deterministic validation.
// playwright-googlebot-sim.js
import { chromium } from 'playwright';

(async () => {
 const browser = await chromium.launch({ headless: true });
 const context = await browser.newContext({
 userAgent: 'Mozilla/5.0 (compatible; Googlebot/2.1; +http://www.google.com/bot.html)',
 viewport: { width: 1280, height: 800 }
 });
 const page = await context.newPage();

 // Enable network interception for waterfall analysis
 await page.route('**/*', route => {
 if (route.request().resourceType() === 'script' && route.request().url().includes('analytics')) {
 route.abort(); // Simulate blocked third-party
 } else {
 route.continue();
 }
 });

 await page.goto('https://your-csr-app.com/product/123', { waitUntil: 'networkidle' });

 // Measurable validation: Extract final DOM length & check for critical content
 const domSnapshot = await page.content();
 const hasCriticalContent = await page.locator('h1').innerText();
 const jsonLdExists = await page.locator('script[type="application/ld+json"]').count() > 0;

 console.log(`DOM Length: ${domSnapshot.length} chars`);
 console.log(`Critical Content Visible: ${!!hasCriticalContent}`);
 console.log(`JSON-LD Present Post-Render: ${jsonLdExists}`);

 await browser.close();
})();
SEO/Rendering Impact:
- Simulating the exact Googlebot UA prevents client-side UA sniffing from serving different markup to crawlers.
- Network interception isolates third-party script impact on render time.
- DOM length and content presence checks provide quantifiable pass/fail metrics for CI/CD pipelines.
Step 4: Automate Pipeline Audits
Integrate headless DOM snapshots into CI/CD using Lighthouse CI or custom Playwright tests. Fail deployments if critical selectors or structured data are missing from the post-render snapshot.
Optimization Patterns for CSR Pipelines
To accelerate rendering and reduce queue wait times, implement these technical SEO patterns:
- Route-Level Code Splitting: Break bundles at route boundaries using dynamic imports. This minimizes the initial execution payload and allows WRS to prioritize critical route hydration.
- Pre-Render Critical Routes: Generate static HTML for high-traffic or conversion-critical pages. Serve a fallback HTML shell immediately while the client hydrates.
- Resource Hints: Use
rel="modulepreload"to instruct the browser to fetch critical modules before execution begins. - Defer Non-Critical State Initialization: Delay analytics, chat widgets, and heavy state stores until after
requestIdleCallbackorwindow.onload.
// Route-level dynamic import with modulepreload hint
const routes = [
 {
 path: '/checkout',
 component: () => import(/* webpackChunkName: "checkout" */ './views/Checkout.vue')
 }
];

// Inject modulepreload hint in <head> during initial render
function preloadRouteModules() {
 const link = document.createElement('link');
 link.rel = 'modulepreload';
 link.href = '/assets/checkout-abc123.js';
 document.head.appendChild(link);
}
SEO/Rendering Impact:
- Dynamic imports reduce Time to First Byte (TTFB) and JavaScript execution time, directly lowering the probability of WRS timeout.
modulepreloadeliminates network latency for critical chunks, ensuring the main thread isn’t blocked waiting for dependency resolution.- Deferring non-critical hydration preserves CPU cycles for primary content rendering, improving DOM snapshot completeness.
Common Pitfalls
- Infinite Hydration Loops: React
useEffector Vuewatchdependencies that trigger re-renders during hydration can exhaust WRS execution budgets. Always stabilize state before mounting. - Blocking Main Thread with Synchronous XHR: Legacy
XMLHttpRequestcalls halt JavaScript execution. Replace withfetch()and ensure promises resolve before DOM snapshot. - Relying on
setTimeoutfor Content Injection: WRS does not wait for arbitrary timers. Inject primary content synchronously during hydration or useIntersectionObserverwith immediate fallbacks. - Ignoring
robots.txtfor Assets: Blocking CSS or JS files inrobots.txtprevents WRS from downloading them, resulting in unstyled pages and missing functionality during indexing.
These four pitfalls take different routes but converge on the same failure — the WRS captures an incomplete DOM.
FAQ
How long does Googlebot typically wait before rendering a client-side app? Google queues pages for rendering after the initial crawl, with wait times ranging from a few hours to several days depending on site authority, crawl budget, and server response times.
Does Googlebot execute all JavaScript on a CSR page? Googlebot executes most modern JavaScript, but it enforces execution timeouts and resource limits. Heavy bundles, infinite loops, or blocked third-party scripts may cause partial or failed rendering.
Can I force Google to render my JavaScript immediately? No. Rendering is queued automatically. You can accelerate discovery via sitemaps, internal linking, and URL Inspection Tool requests, but pipeline timing remains controlled by Google’s infrastructure.
How do I verify if Googlebot sees my dynamically injected content? Use headless browser simulation with the Googlebot user-agent, inspect the rendered DOM via DevTools, and validate content visibility using the URL Inspection Tool’s ‘View Crawled Page’ feature.
In this guide
- How to check if Googlebot executes your JavaScript — deterministic execution tests.
- How the Web Rendering Service queue delays indexing — why the second wave lags and how to shorten it.
Related
- JavaScript Execution Limits and Crawl Budget — the budget that caps each render.
- Client-Side vs Server-Side Rendering for SEO — skip the render queue for core pages.
- SEO Audit Workflows for Client-Side Apps — confirm what the pipeline actually rendered.
← Back to Crawling & Rendering Fundamentals